One of the most complete national LiDAR programmes anywhere — used automatically, not just offered.
IGN's LiDAR HD is flying the whole country at 10 points per square metre, closing in on full coverage of mainland France and its overseas territories. GridVisio pulls this data in automatically wherever it's landed — a link in the Vosges, a mast reaching across a Massif Central valley, a backhaul hop along the Breton coast — and falls back gracefully where the survey hasn't reached yet.
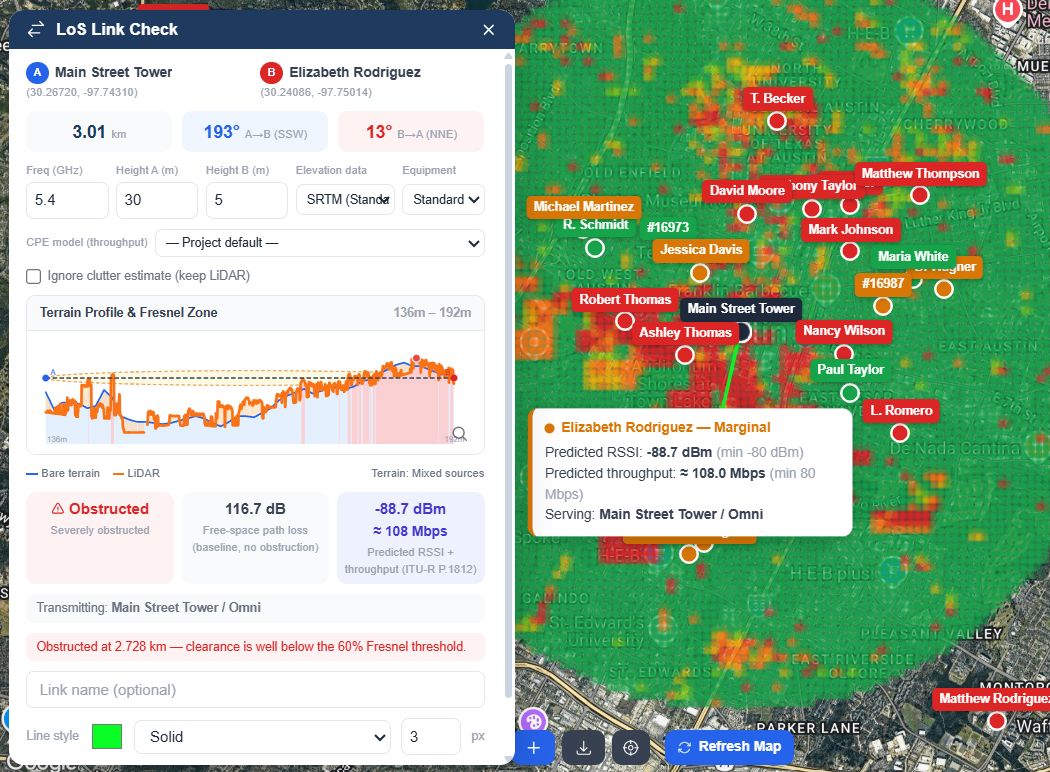
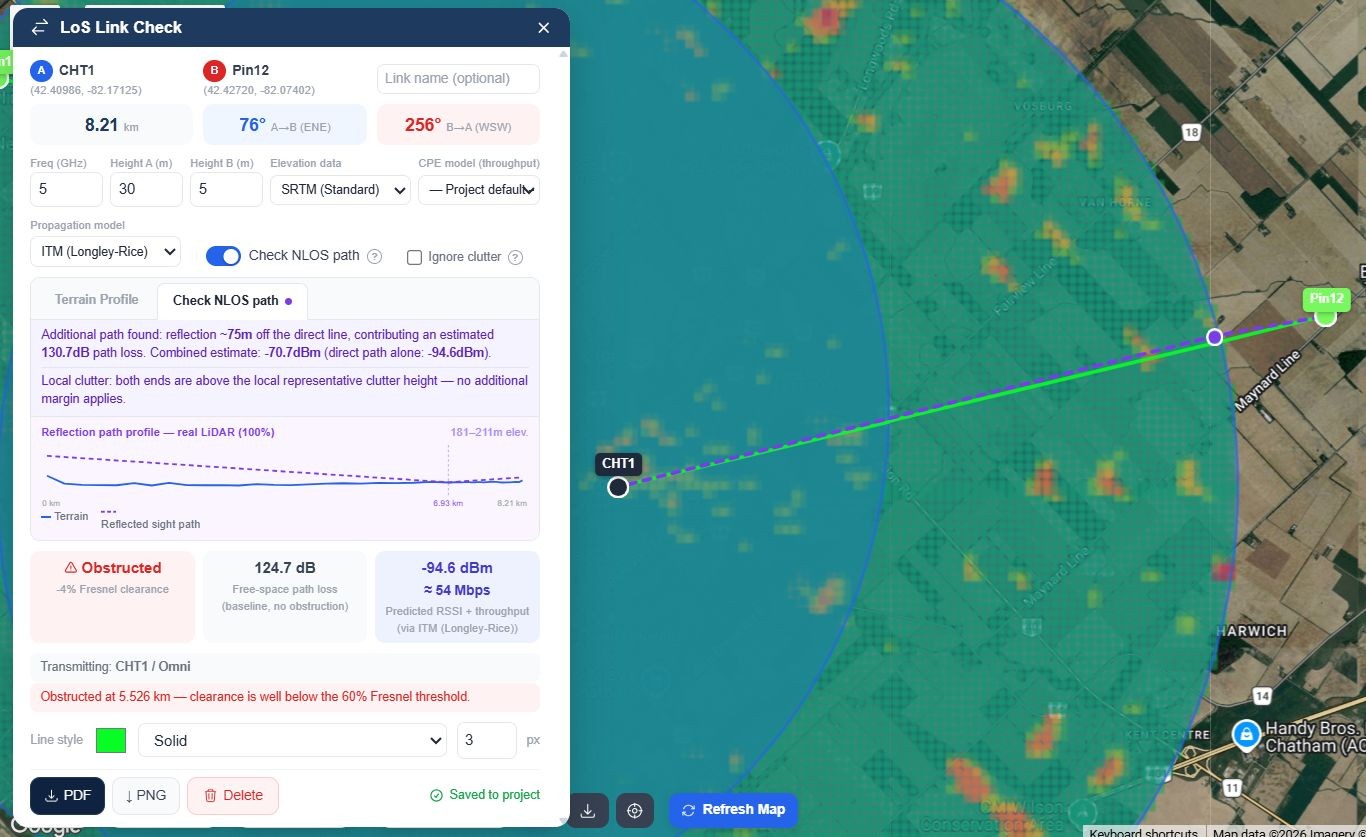
A real link check running on LiDAR HD-sourced terrain, not a generic global DEM
Why French WISPs end up here
Not a US tool with a France checkbox added later. The elevation pipeline, plan limits, and export options were built around how independent wireless operators actually plan links here.
Real LiDAR HD, not SRTM
IGN's national LiDAR HD programme — a real 1m surface model, buildings and vegetation included, flown from a genuine 10-points-per-square-metre point cloud — is pulled in automatically wherever it's landed. No setting to enable. Where the survey hasn't reached a given stretch yet, links fall back to SRTM 30m instead of failing outright.
Real backhaul distances
10km link length on Starter, 20km on Pro — enough for a genuine ridge-to-valley hop in the Alps or Pyrenees, not just a last-mile drop. Fresnel clearance, bearing, and FSPL computed identically at any length.
Honest verdicts, not a confident guess
Clear, Borderline, or Obstructed — Borderline is flagged as inconclusive instead of rounded up either way. Whoever reviews the result afterward — a partner, a subsidised-offer auditor, your own install crew — gets the same answer every time it's opened.
Predicted signal, not just geometry
ITU-R P.1812 propagation prediction alongside the Fresnel check, extending to ITM or FSPL+P.526 outside its frequency range — a dBm number and, with a CPE model selected, an estimated Mbps. The same engine drives the RF Heatmap so numbers never contradict each other.
Find where to build next
Import your own subscriber list and GridVisio clusters unserved locations by density (DBSCAN), then estimates reach from a hypothetical mast before you commit to a site visit — one more way to make the case, whether that's for your own build plan or for a subsidised "boucle locale radio" offer under Cohésion numérique des territoires.
Coverage widget for your own site
Embed an address-check widget on your website. A visitor's address gets a real LoS check against your nearest masts, not a polygon overlap — so the lead you receive already tells you which site would serve them.
A fold in the Massif Central doesn't show up in a 30m cell
A backhaul hop across a Pyrenean valley, a link skirting a ridge in the Vosges, a mast reaching over Breton hedgerow country — these are exactly the cases where a coarse 30m global elevation model quietly gets the answer wrong. LiDAR HD's 1m resolution, built from a genuinely dense point cloud, catches the ridge, the tree line, or the roofline a generic DEM smooths straight through.
Where the survey hasn't reached a given stretch yet — a shrinking gap as the programme nears full national coverage — GridVisio falls back to SRTM 30m automatically rather than refusing to run, and always states which source produced the result you're looking at.
Fresnel clearance computed against real 1m surface data, not a smoothed approximation
One coverage map, every layer you actually maintain
Towers and sectors, subscribers, saved LoS links, unserved clusters — all on one map, toggleable by layer. Run an RF Heatmap per sector or per site and see predicted signal strength across your whole footprint, using the same propagation model as the link checker.
Export a clean PDF or PNG of any link check for a customer file, an internal record, or whatever documentation a partner or subsidised-offer process needs — no extra formatting step, no per-file fee.
RF Heatmap for a sector, driven by the same propagation engine as the LoS checker
Frequently asked questions
Does GridVisio actually cover my part of France?
It depends on where IGN's LiDAR HD programme has flown, which by late 2025 already covered a large majority of metropolitan France and is targeting full national coverage (including most overseas territories) by the end of 2026. Wherever it's landed for a given link or heatmap area, GridVisio uses it automatically at 1m resolution. Outside that coverage, it falls back to SRTM 30m rather than refusing to run — and the result always states which source it used, so you're never guessing.
What's the difference between LiDAR HD and the SRTM data most tools use everywhere?
SRTM is a 30m-resolution global radar dataset — fine for a rough first pass, but it can average away a ridge, a hedgerow, or a rooftop that sits inside a single 30m cell. LiDAR HD is a 1m surface model built from a genuinely dense (10 points per square metre) airborne point cloud, so features that actually intrude on a Fresnel zone show up instead of getting smoothed out.
Can this help with a Cohésion numérique des territoires application, or similar?
GridVisio isn't a filing tool for Cohésion numérique des territoires or any specific subsidy scheme and doesn't generate its paperwork — but the fit is more direct here than in most countries, since "boucle locale radio" (fixed wireless) is explicitly one of the technologies that programme subsidises. What GridVisio gives you is exportable, defensible link and coverage data — terrain profile, Fresnel clearance, predicted signal strength — as a PDF or PNG you can attach to whatever documentation the offer requires.
Is pricing in euros?
Both — USD ($19/month Starter, $39/month Pro) and EUR are available, switchable from your billing page. Both plans include a 14-day free trial with no credit card required to start, and there's also a permanent $0 Free plan with core Starter features included.
Do I need to import my own subscriber and mast data?
Yes — towers, sectors, and subscribers are imported via CSV/XLSX or entered directly on the map. Once they're in, white area detection, reach estimates, and the RF Heatmap all run against your real network, not a sample dataset.
See your own network on real French terrain
14-day free trial — LoS checker, RF heatmap, white area detection, and more. No credit card required.