Validate any wireless link before you climb the tower.
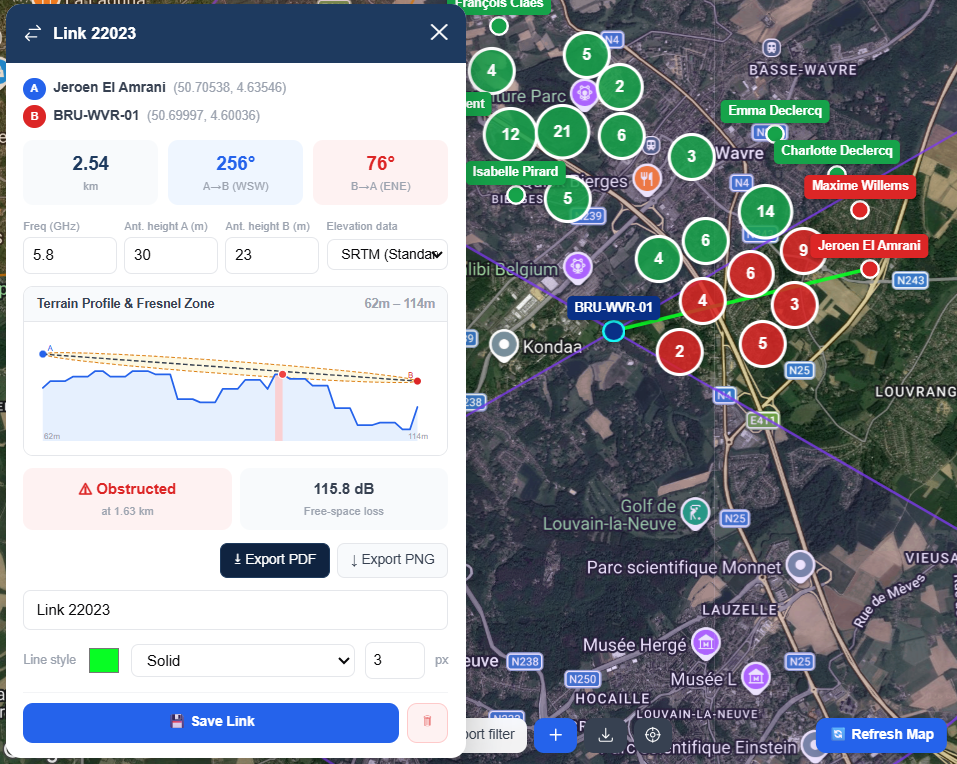
GridVisio's LoS Link Check gives you an instant terrain cross-section with the first Fresnel zone, obstruction detection, bearing, and free-space path loss — for any two map points. Real USGS 3DEP LiDAR data is used automatically where available in the US, layered with land-cover-aware vegetation/building estimates and three bare-elevation sources. Export as PDF or PNG.
Click any two points on your coverage map — tower to subscriber, hypothetical site to cluster, or any two custom pins. The analysis runs in seconds.
Terrain cross-section
Elevation profile between any two map points, automatically enriched with real LiDAR height where available in the US (USGS 3DEP), Canada, UK, France, the Netherlands, Spain, and New Zealand, and land-cover-aware vegetation/building estimates elsewhere. Click to zoom in and pan around any stretch of the path. See exactly where the path rises above line-of-sight.
First Fresnel zone
The Fresnel ellipsoid is overlaid on the terrain profile. Any intrusion into the first zone is flagged as an obstruction — stricter than line-of-sight alone.
Honest, tiered verdict
Clear, Borderline, or Obstructed — not a coin-flip binary. Borderline calls are flagged as inconclusive instead of guessed either way, with the exact Fresnel clearance % and free-space path loss in dB shown alongside. Compare results across three elevation sources.
Predicted signal strength (dBm)
A real propagation prediction (ITU-R P.1812 by default, automatically extending to ITM or FSPL+P.526 for frequencies outside its range) alongside the geometric verdict — a dBm number and, with a CPE hardware model selected, an estimated throughput in Mbps.
NLoS reflection / multipath path check
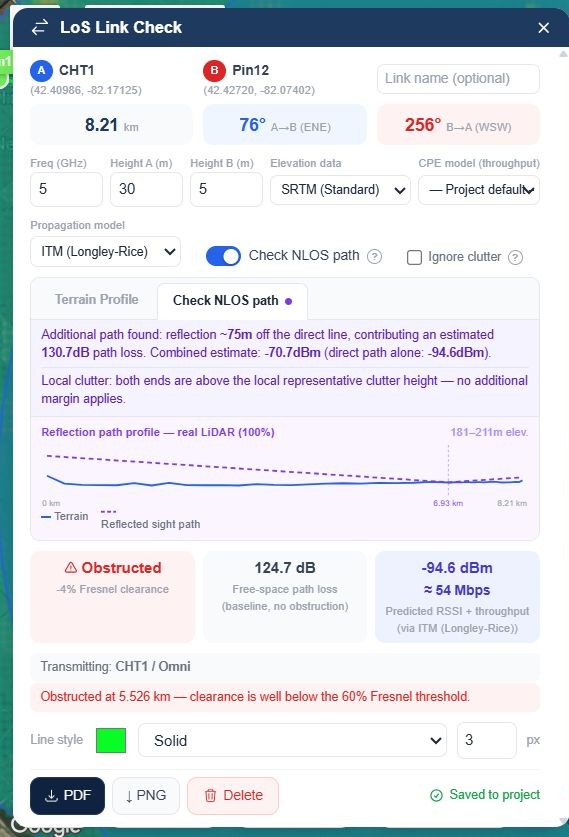
On a Borderline or Obstructed link, an on-demand check searches for one possible reflected signal path off nearby terrain — reflection offset, added path loss, and a combined RSSI estimate, backed by the same real-LiDAR precision as the main check. Alongside it, a separate ITU-R P.2108 statistical clutter margin covers the dense-suburban case where there's no single obvious reflector, just many small unresolvable scatterers. Geometry only, not a substitute for what Tarana or other genuine NLoS-capable radios do internally — see the FAQ below for the honest distinction.
3D Corridor Check Pro
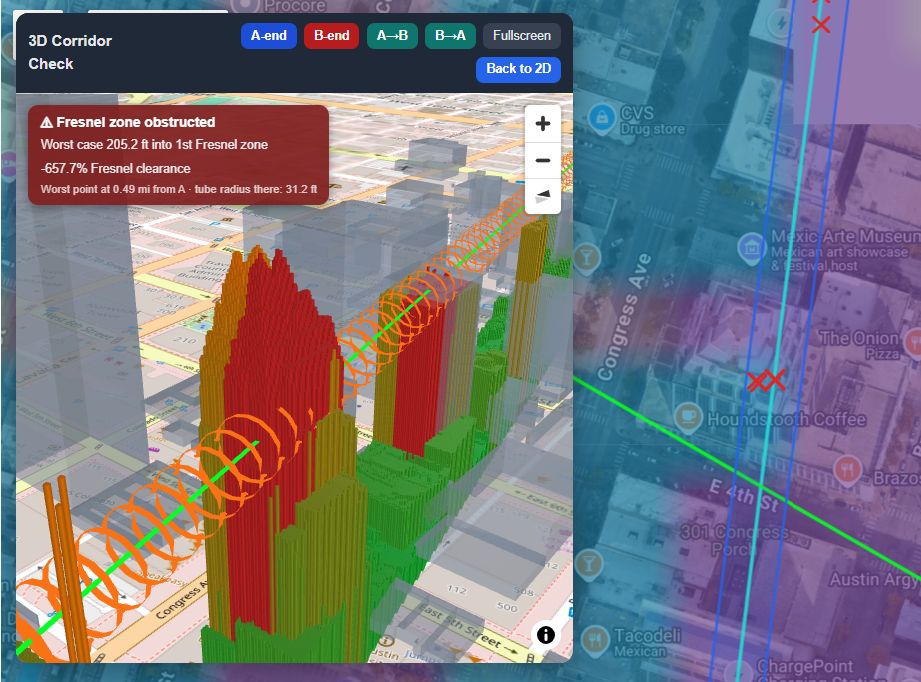
An interactive 3D view of the actual LiDAR terrain and surrounding buildings along the link, with the same real Fresnel zone geometry drawn right on top — orbit, zoom, or fly the camera from one antenna to the other. Click anywhere in the 3D scene to jump the 2D map to that exact spot.
Export PDF or PNG
Generate a clean PDF or PNG of the terrain profile, Fresnel zone, and link details. Share with clients or attach to grant documentation.
Save links on the map
Save LoS links with custom colour, line style, and width. Saved links are visible alongside towers and subscribers on your coverage map.
Three elevation sources
SRTM 30m (global default), ASTER 30m (global alternative), and USGS NED 10m (continental US, highest precision). Real USGS 3DEP LiDAR and land-cover height estimates are layered on top automatically, whichever bare elevation source you pick.
Fade margin for Clear links
On an already-Clear link, a second tab reports the ITU-R P.530 fade margin — how much signal headroom (dB) it needs in reserve for ordinary weather/atmospheric fading at a given availability target (e.g. 99.9%, 99.99%). Computes automatically, no extra terrain fetch needed.
Height Optimizer
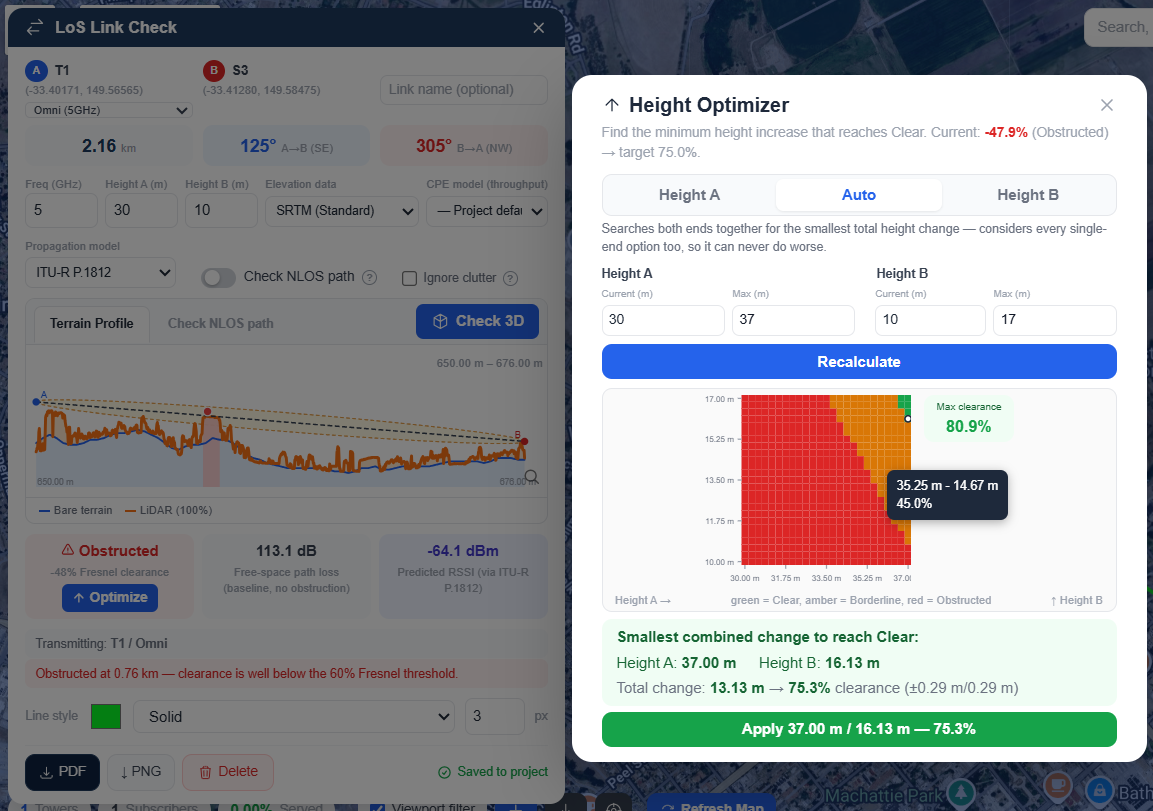
On a Borderline or Obstructed link, one click finds the minimum antenna height increase that reaches Clear — or, on an already-Clear link, how low you could actually go. A colored grid sweeps both antenna heights together and shows every real combination at once, not just one guess.
Validate from a hypothetical tower site
Drop a hypothetical tower pin anywhere on the map, then use the LoS tool to check links from that location to any subscriber or point. Evaluate a potential site before committing to installation.
The Reach Estimate panel shows how many unserved subscribers fall within the configured radius and beamwidth — live as you adjust parameters. Promote to a real tower with one click when you're confident.
LoS link parameters — distance, bearing, frequency, antenna heights
Check a multipath / NLoS reflection path too
On a Borderline or Obstructed link, switch on Check NLoS path and GridVisio searches for one possible reflected signal path off nearby terrain — the reflection's offset from the direct line, the loss it adds, and a combined RSSI estimate next to the direct-path-only number. It reuses the same real-LiDAR terrain precision as the main check, across all supported regions. A second tab, Terrain Profile, holds the usual Fresnel chart — switching between them never re-runs anything, only the toggle itself fetches.
Right below the reflection result, a separate local clutter margin (ITU-R P.2108) covers the case a single reflection search can't: dense suburban or urban clutter with no one identifiable reflector, just many small unresolvable scatterers around a terminal. It reports a typical added loss and a worst-case RSSI, from frequency and distance alone — no extra terrain fetch, no guessed land-cover category, and never folded into the reflection number above since it's a different physical claim.
It's honest about what it is: a single geometric reflection candidate, combined as power not phase — useful extra context for Tarana and other NLoS-capable deployments, not a model of what that hardware does internally. See how this fits into planning NLoS deployments →
NLoS reflection path result on a real Obstructed link, with the local clutter margin below it
Know exactly how high to mount it
A Borderline or Obstructed verdict answers "is this link clear" — it doesn't answer "how much higher would it need to be." The Height Optimizer does: click the Optimize button right in the clearance badge and GridVisio searches real antenna-height combinations using the exact same Fresnel engine as the main check, then reports the smallest change that reaches Clear. On a link that's already Clear, it asks the opposite question — how low could this mast actually go and still hold.
Auto mode searches both antenna heights together, not just one at a time, and shows the whole search as a colored grid — green where the link would be Clear, amber for Borderline, red for Obstructed — instead of a single number you have to trust blind. Hover any cell for its exact heights and clearance percentage, or click one directly to apply that combination instead of the automatic pick: maybe raising the tower side is impractical this week and the subscriber's pole is the one that can actually go higher. The grid shows every real option so that's your call to make, not GridVisio's.
Current and Max/Min height fields for both ends stay editable the whole time as a draft — nothing changes on the real link until you click Apply, so exploring "what if the other end were mounted higher too" never risks the link you already have.
Auto mode: every real height combination for both ends, colored by Clear/Borderline/Obstructed
See the corridor in 3D, not just a chart
Click Check 3D on any LoS Link Check and GridVisio renders an actual three-dimensional view of the link's real LiDAR terrain and surrounding buildings (Pro plan) — the same real measured data behind the 2D terrain profile, now something you can orbit, zoom into, and fly through. Building footprints (from OpenStreetMap, including real stepped/setback towers) are drawn semi-transparent so the LiDAR detail underneath never disappears behind a solid block.
The exact same first Fresnel zone geometry as the 2D check runs through the scene as a series of rings, and any cell that intrudes into it is highlighted in red — the same intrusions get plotted as red markers directly on the 2D map too, so you can still see exactly where a check found trouble without reopening the 3D view. Click anywhere in the 3D scene — terrain or building — and the 2D map jumps to that exact real-world point, using a real depth-corrected read rather than a rough click-ray guess.
Jump the camera straight to either antenna, or fly a walkthrough from one end to the other — pan, zoom, or rotate mid-flight and it pauses right where you left it, ready to continue from that exact point and angle instead of starting over. Record the flight to a video file, straight from your browser, to share with a customer or colleague. Reopening the 3D view for a link you've already checked is instant — nothing re-fetches until you change something.
A real link's 3D corridor: LiDAR terrain, nearby buildings, and the Fresnel zone rendered together
Flying the same 3D corridor end to end — pause, reposition, and continue, or record the flight to a video
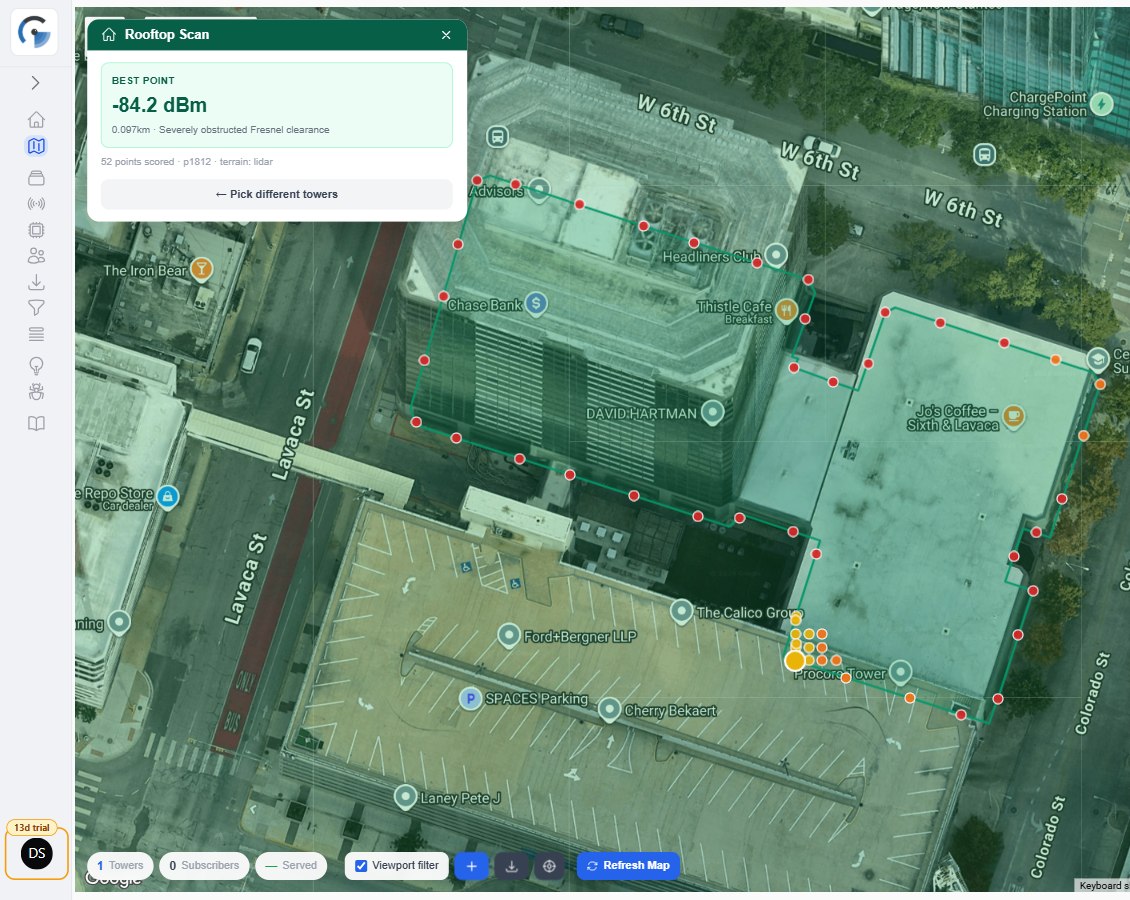
Don't know which spot on the roof to check? Let Rooftop Scan find it
LoS Link Check answers "is this one exact point clear." Rooftop Scan (Pro plan) answers the question that usually comes first: where on a specific building should that point even be. Click a rooftop on the map and GridVisio auto-detects its real footprint — OpenStreetMap's traced outline first, falling back to a live LiDAR scan when OSM has no data for that address — then scans a ring of realistic mounting points around its edge against your chosen tower and surfaces the single best one.
It's built directly on top of this same engine: every candidate point's Fresnel profile is computed with the exact dense, real-LiDAR-merged terrain data a manual LoS Link Check line would use, not a coarser approximation — so a Rooftop Scan result and a LoS Link Check drawn to the same point agree. Any candidate opens straight into the full LoS Link Check panel, pre-filled, if you want to dig into antenna height, frequency, or CPE equipment beyond what the scan itself assumed.
A real rooftop scan: every candidate point around the roof edge scored, best point highlighted
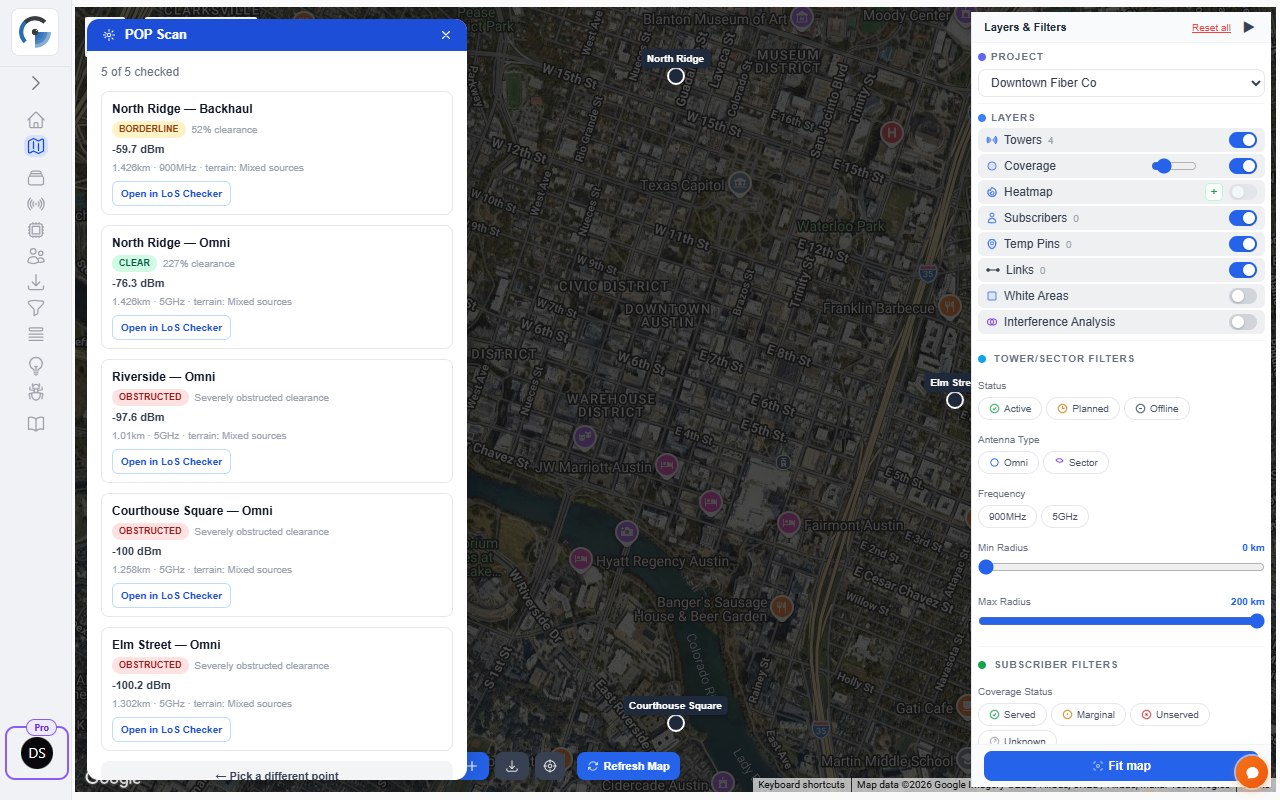
Which of your towers reaches this roof — and how high must the antenna go? Click and see
LoS Link Check answers "is this one specific tower clear to this point." POP Scan (Pro plan) answers the question that comes up at every install survey: switch it on and click a roof — or any spot, a subscriber, an existing tower — and GridVisio checks that point against every tower/sector (POP) whose coverage reaches it, including overlapping sectors on the same tower, and shows the results in a compact table right at the click. Click the next roof and the table updates.
For each tower/sector you get the Fresnel clearance and predicted signal at the antenna height you choose — above the roof as measured by LiDAR, or above the ground — plus the lowest height needed for each signal level from −90 to −42 dBm, and the height from which the Fresnel zone stays clear. Moving the height slider updates instantly. The first click in an area reads the LiDAR; clicks within about 50 m after it reuse it and come back much faster. It's built on this same engine, not a faster approximation: every number is the one a manually-drawn LoS Link Check of that exact link and height would give, and any row opens straight into the full LoS Link Check panel, pre-filled.
A real POP Scan on a roof: every tower/sector, its signal at 2 m above the roof, and the height needed for each signal level
LoS powers the lead widget too
The same LoS engine that powers the map tool also runs inside the coverage widget embedded on your website. When a visitor checks their address, GridVisio runs a real LoS analysis to your nearest towers — not just a polygon overlap.
The lead you receive is already qualified: you know which tower serves them, whether the path is clear, and the free-space path loss before you make the first call.
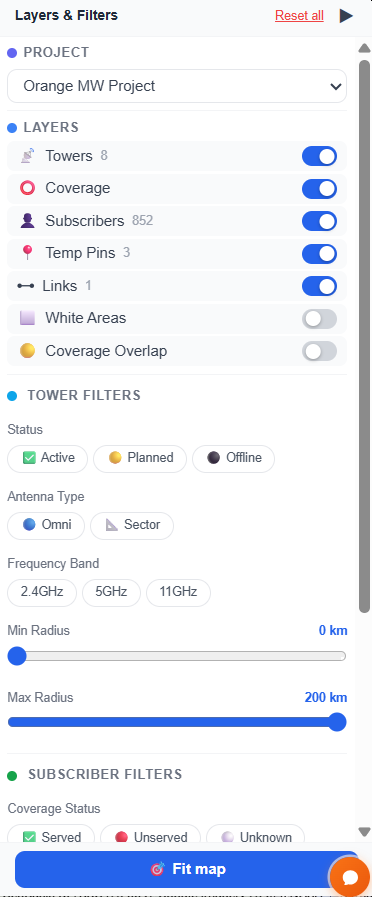
Layers panel with LoS links visible
Frequently asked questions
What elevation data does the LoS checker use?
Three sources: SRTM 30m (global default), ASTER 30m (global alternative), and USGS NED 10m (continental US only — highest resolution for US deployments). Choose per analysis.
Does GridVisio use real LiDAR data?
Yes. For US locations covered by the free public USGS 3DEP LiDAR dataset, GridVisio automatically uses the real measured surface height — the actual treetop or rooftop near each point on the path, not a category estimate — with no setting to turn on. The same real-measurement precision is also available automatically in England, Wales, Scotland, Canada, France, the Netherlands, Spain, and New Zealand, from each country's own free public LiDAR program. None of these nine sources has nationwide coverage yet, so where none is available GridVisio falls back to a land-cover-based vegetation/building estimate (NLCD in the US, ESA WorldCover elsewhere), then bare elevation. The terrain source actually used is always shown with the result. US links can use LiDAR up to 20 km; the other eight regions have a length limit based on your plan (5 km Free, 10 km Starter/Trial, 20 km Pro) — long enough for real long-haul backhaul links.
What is the Fresnel zone and why does it matter?
The Fresnel zone is an ellipsoid around the line-of-sight path. For reliable radio performance, the first Fresnel zone must be at least 60% clear. A link can appear line-of-sight but still be degraded if terrain intrudes into the first Fresnel zone. GridVisio doesn't just flag pass/fail at that 60% line — Borderline results near it are flagged as inconclusive rather than forced into a confident Clear or Obstructed call.
Does the LoS checker predict actual signal strength, not just clear/obstructed?
Yes, on Pro plans and during your trial. Alongside the Fresnel geometry, GridVisio runs a real propagation prediction (ITU-R P.1812, ITM, or FSPL+ITU-R P.526, whichever covers the link's frequency) and shows a predicted RSSI in dBm — the same engine that also drives subscriber coverage classification and the RF Heatmap, so numbers stay consistent everywhere in the app. Select a CPE hardware model and it adds an estimated throughput in Mbps on top, computed from that radio's real MCS/sensitivity table. Changing frequency or antenna height marks the RSSI number stale with a one-click Re-check, rather than silently showing an outdated figure.
I use NLoS-capable equipment (e.g. Tarana) — does this still apply to me?
Yes, and there's something specifically for this case: on a Borderline or Obstructed result, an on-demand NLoS reflection path check searches for one possible reflected path off nearby terrain (real-LiDAR-aware, same precision as the main check) and shows its added path loss and a combined RSSI estimate alongside the direct-path-only number. Alongside it, a separate ITU-R P.2108 clutter margin covers dense-suburban links with no single identifiable reflector. Both test/estimate geometrically or statistically, combining as power, not phase — neither is a model of the multipath signal reconstruction Tarana or similar NLoS radios perform internally, and we don't claim they are. Treat them as extra, real data points beyond the direct line, not a replacement for your hardware vendor's own NLoS link-budget tools. See our NLoS & multipath planning page for the full honest breakdown of what this does and doesn't do.
Can I check LoS from a hypothetical tower location?
Yes. Drop a hypothetical tower pin anywhere, then use the LoS tool to check links from that location to any subscriber or point.
Does the LoS tool account for antenna height?
Yes. Set antenna height at both endpoints. The terrain clearance check is calculated from the antenna height above ground, not ground level.
A tower has more than one sector pointed the same direction — which one does the check use?
GridVisio auto-picks one to start, but you're not stuck with it: whenever an endpoint is a tower, a small dropdown appears right under its name listing every sector on that tower that geometrically covers this specific link — including two or more overlapping ones on different frequencies. Pick a different one and the tool applies its real antenna height/frequency and reruns the full check, RSSI included. Sectors within range are listed first, sectors beyond a sector's declared range after — still selectable, never hidden, since checking a link deliberately beyond a sector's nominal range is a legitimate thing to want to do with this tool.
Can I export the LoS analysis for a grant application?
Yes. Export PDF or PNG for a clean report including the terrain profile, Fresnel zone, link parameters, and verdict — useful for BEAD and other broadband grant applications.
What does the 3D Corridor Check show that the 2D terrain chart doesn't?
The same real LiDAR terrain measurement and Fresnel geometry, rendered as an explorable 3D scene instead of a 2D chart — real terrain height along the whole corridor width (not just the path line), nearby buildings extruded to their real height (including real stepped/setback towers), and the Fresnel zone as a series of rings you can orbit around. It's a visual companion for the cases where seeing the actual obstruction — a specific rooftop, a stand of trees — is clearer than reading a clearance percentage. Click Check 3D from any LoS Link Check to open it — a Pro plan feature (also included in the 14-day trial).
How is Rooftop Scan different from LoS Link Check?
LoS Link Check tests one exact point you choose. Rooftop Scan (Pro plan) starts one step earlier: click a building and it auto-detects the roof's real footprint, then scans a ring of candidate mounting points around its edge for you, surfacing the best one — using the same dense real-LiDAR terrain engine, so the two tools' numbers agree for the same point.
How is POP Scan different from LoS Link Check and Rooftop Scan?
LoS Link Check tests one tower against one point. Rooftop Scan tests one tower against many candidate points on a roof. POP Scan (Pro plan) is the reverse: click a point and it checks every tower/sector that can reach it, including overlapping sectors on the same tower — with the signal at your chosen antenna height and the height needed for each signal level — then click the next spot and it updates, instead of you drawing a separate link to each tower by hand.
Does POP Scan use a faster, less accurate check to cover multiple towers?
No. Every tower/sector and every height is computed with the exact same line-of-sight and signal computation a manually-drawn LoS Link Check uses — the same real LiDAR and terrain data, measured ground, Fresnel-zone math and propagation model — so every number matches what you'd get drawing that link yourself. Nearby clicks are faster only because the LiDAR already read for the area is reused, never because of a coarser shortcut.
A link is Borderline or Obstructed — how do I know how much higher to mount the antenna?
Click Optimize right in the clearance badge. The Height Optimizer searches real antenna-height combinations — one end at a time, or both together in Auto mode — using the exact same Fresnel engine as the main check, and reports the smallest change that reaches Clear. Auto mode shows the whole search as a colored grid instead of a single guess, so you can see every real option (maybe the subscriber's pole has more room to go up than the tower does) and click any cell to apply that exact combination. It works the other way too: on an already-Clear link, it finds how low a mast could go and still hold, useful before ordering shorter, cheaper hardware.
Validate your links before you build
14-day free trial — LoS checker, white area detection, BDC export, and more. No credit card required.