Interactive Coverage Map
Visualize towers, directional and omni sectors, and subscriber locations on a satellite map with real-time
filtering by frequency, status, and coverage.
Tower & Sector Management
Add and edit towers with full sector configuration — azimuth, beamwidth, radius, frequency band, colour-coded
coverage shapes. Save your own equipment presets (or start from built-in Ubiquiti, Cambium, and Mimosa specs)
to
fill sector RF parameters in one click. Edit directly on the map.
Subscriber Tracking
Import thousands of subscribers via CSV or XLSX. Coverage status (served/unserved/potential) is calculated
automatically whenever towers change.
White Area Detection
Automatically identify clusters of unserved subscribers using DBSCAN spatial clustering. Visualize coverage
gaps as polygons to guide new tower placement.
Learn
more about White Area Detection →
Coverage Overlap Analysis
Detect overlapping sectors between towers on the same frequency band — identify potential interference and
redundant coverage areas.
Learn
more about Coverage Overlap →
Drive Test Overlay
Import GPS-timestamped signal strength measurements and overlay them on the map as a colour-coded track. See
real measured signal vs planned coverage.
Lambert Converter
Convert between WGS84 lat/lng and Belgian Lambert 72, 2008, and 2005 coordinate systems directly on the map.
Click any point to read formats.
Shared Map Links
Share read-only map views with clients, stakeholders, or regulators via a secure token-based link with
optional expiry. No account required to view.
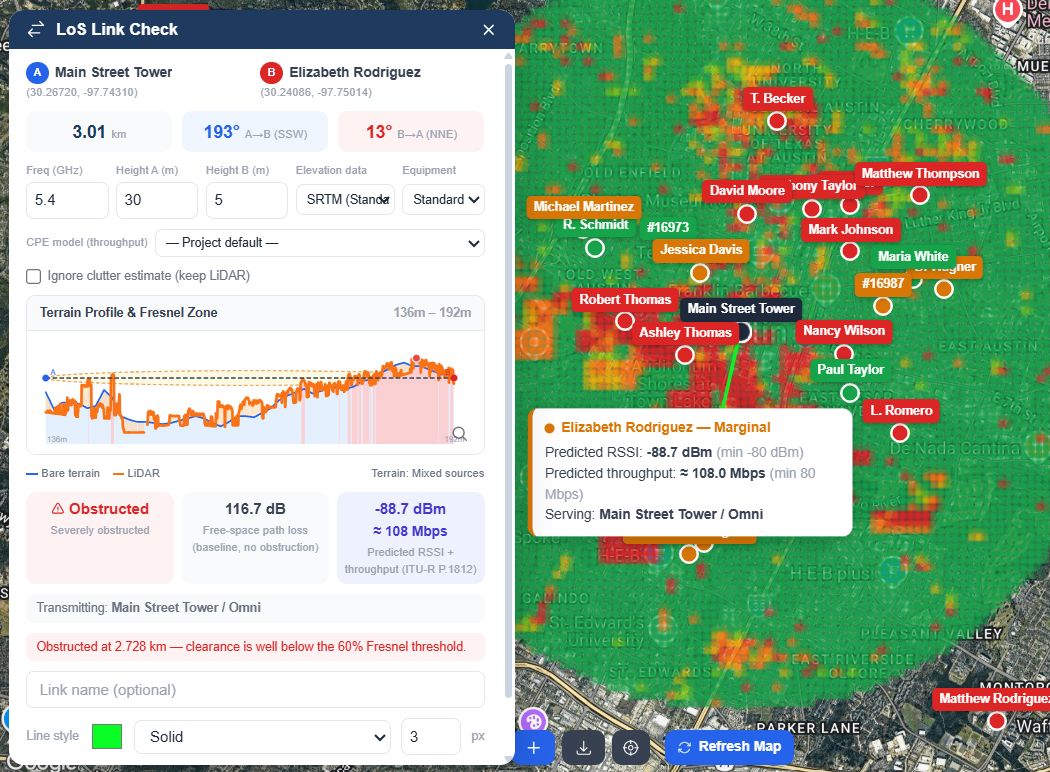
LoS Link Check & Fresnel Zone
Validate line-of-sight between any two map points. Terrain cross-section with first Fresnel zone overlay
gives a Clear / Borderline / Obstructed verdict — not a coin-flip binary — with bearing, free-space path loss,
and real USGS 3DEP LiDAR data used automatically where available in the US. Export as PDF or PNG.
Learn
more about LoS Link Check →
Coverage Widget & Lead Capture Starter
Embed a live serviceability checker on your website with one line of code. Visitors check their address — you
get a qualified, line-of-sight-validated lead delivered to your inbox instantly. Three modes: coverage check
only, lead form first, or coverage-then-capture. Leads land in your GridVisio inbox with
per-tower LoS analysis attached (Pro adds predicted RSSI/throughput). Push leads to your billing system via
webhook or Zapier, or call the same check directly from your own server via the public API.
Learn
more about the Lead Widget →
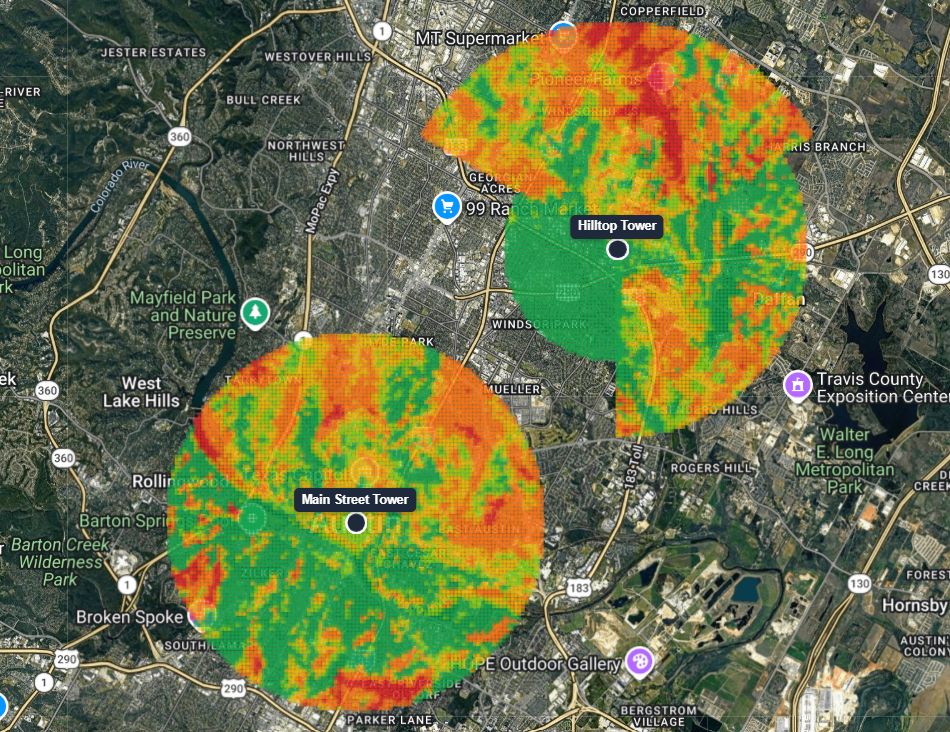
RF Propagation Heatmap Pro
Predict signal strength across your whole coverage area with ITU-R P.1812, a standards-based propagation
model — not a flat radius circle. Computed from real terrain, land cover, and each sector's actual transmit
power and antenna gain. Multi-color layer for internal planning, plus a single-color "covered / not covered"
view for public shared map links.
Learn
more about the RF Coverage Heatmap →
Exports & BDC/BEAD
Export coverage data as PNG, PDF, XLSX, CSV, or KMZ (Google Earth / GIS). Generate BDC filings and a complete
BEAD grant package — PDF report, location inventory, and white-area maps — with automatic terrain and signal
verification built in, directly from your data.
Learn
more about BDC/BEAD export →